Analyzing surfaces: Is 3D better?
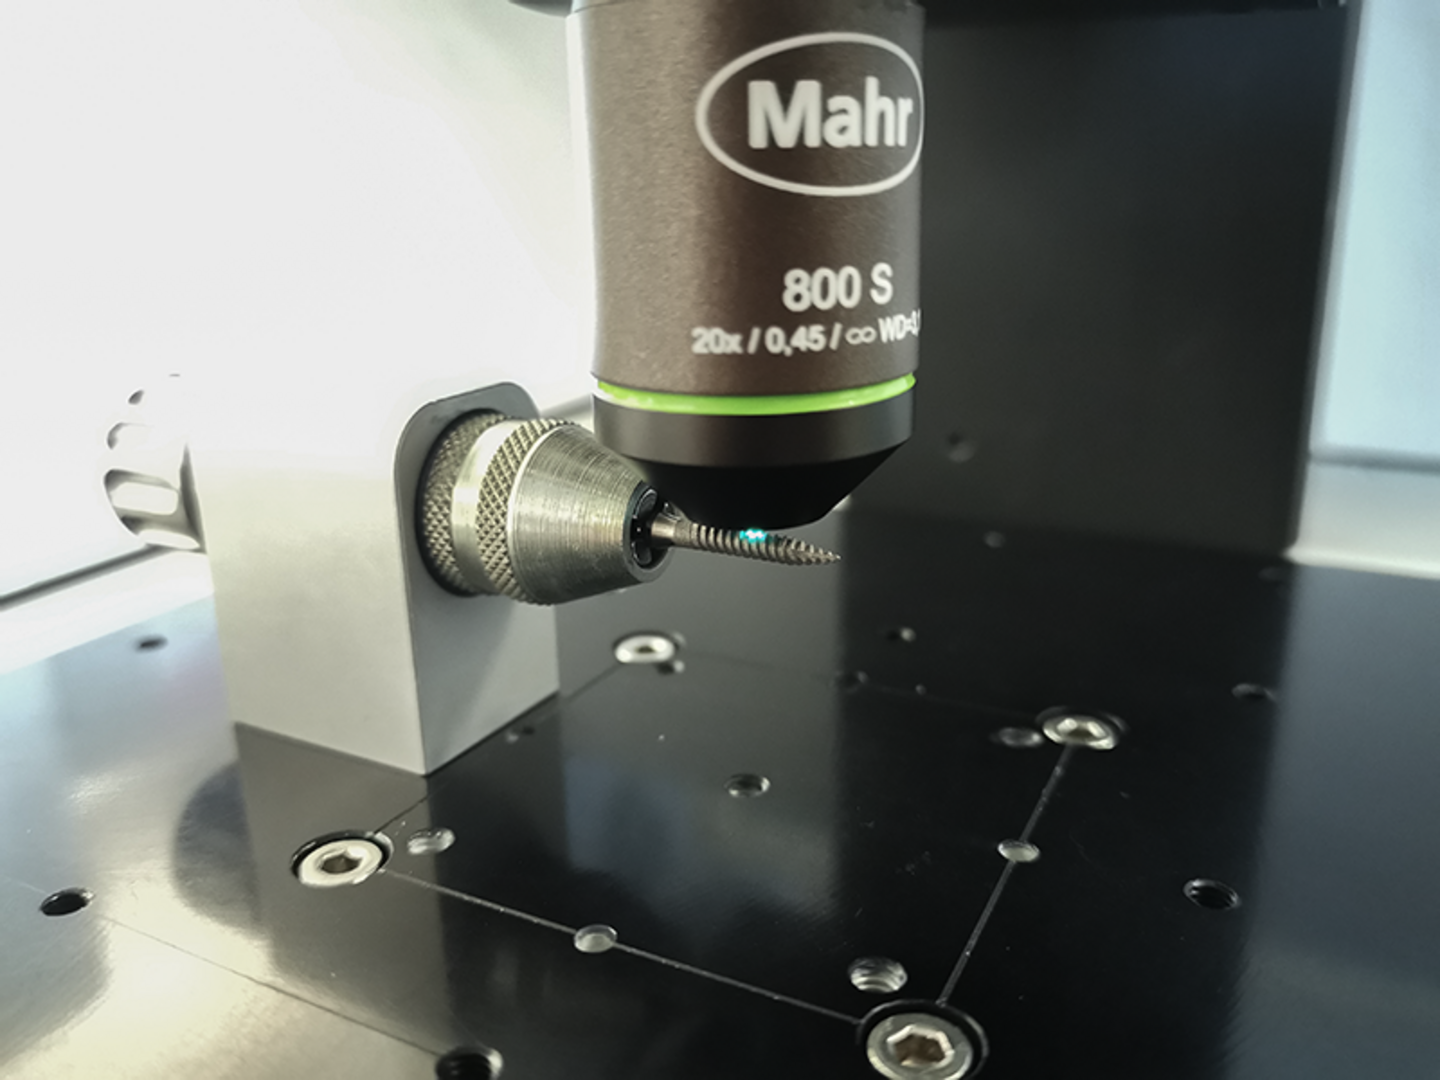
Roughness and waviness measurements are established procedures in quality control. You are probably thinking of a tactile, two-dimensional measurement – like many other metrologists. The data obtained in this way is then evaluated according to DIN EN ISO 4287 / 4288 or DIN EN ISO 13565-1/2, for example. But do you know what the alternative is?
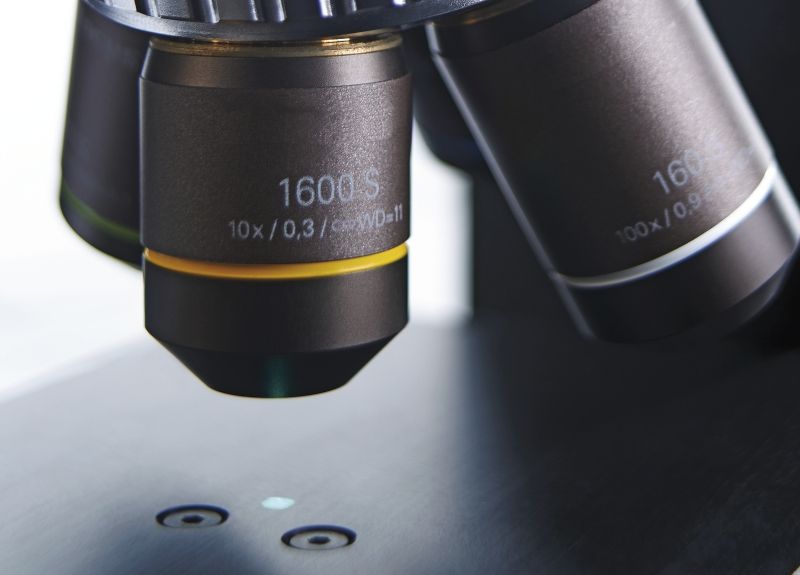
Measuring systems for optical, three-dimensional scanning are now increasingly used in surface analysis. These systems enable an areal analysis of the surface – on the basis of DIN EN ISO 25178. Such an areal evaluation provides characteristic values that cannot be determined by means of the stylus method (or only with considerable time expenditure). Depending on the application, an evaluation of the surface roughness is therefore your only chance to determine whether your product meets the requirements at all.
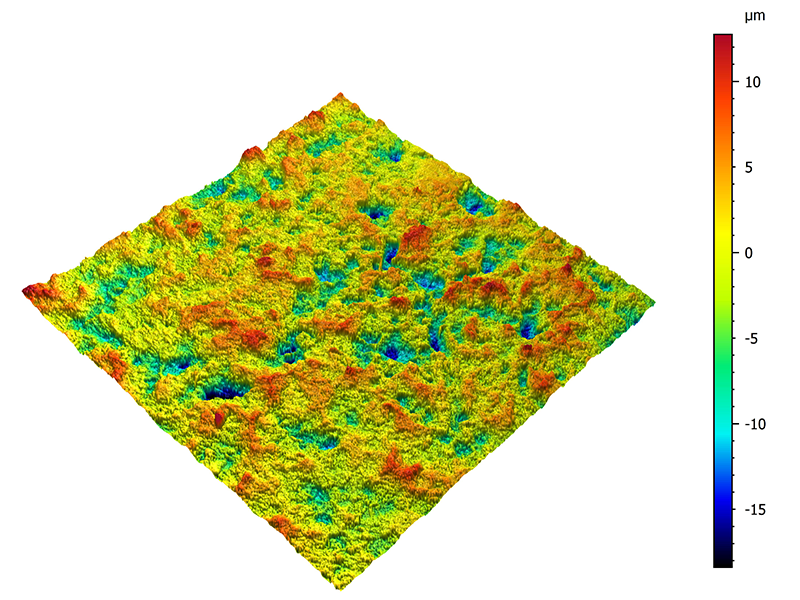
Example: Dental implants
The use of implants in oral surgery requires extremely rough and complex surfaces to which the bones can adhere and grow. Tactile scanning of the implants is difficult due to the design and workpiece geometry alone.
For this example, DIN EN ISO 25178 provides various parameters (Sa, S10z, Sk, Spk and Svk), which have statistical significance for the surface roughness of the implants. Similar to the counterparts known from profile measurement (Ra, Rz, Rk, Rpk and Rvk), they define e.g. the mean roughness or the distribution of the contact areas over the surface.
Getting a qualified result with the surface roughness
But what added value does 3D offer? In addition, the values according to DIN EN ISO 25178 allow a statement about how elevations, plateaus and valleys are statistically distributed over the surface. This information is essential for the manufacturer to be able to determine whether the implants meet the requirements. At the same time, the surface of the implants should be as isotropic as possible - i.e. not have a preferred direction. DIN EN ISO 25178 offers the characteristic value Str, which describes whether certain structures are repeated in one direction on the surface. A comparable statement is not possible with a profile section.
Choosing the right procedure
This raises the question as to which measurement and evaluation method is best suited for your application. Optical or tactile? Profile or surface? The decision is not an easy one, since often both tactile and optical systems can be used – and these can provide quite comparable data. Without knowing applications and requirements in detail, however, the following recommendations can be made:
- Use optical (i.e. non-contact) measuring methods if the surface to be measured is very sensitive or too soft, sticky or discontinuous. In addition, coated and inhomogeneous surfaces or surfaces without machining structures can be detected better optically.
- Rely on three-dimensional, planar measurement data when you are in the process of developing, comparing or optimizing processes – or when no specifications are available for your application. 3D surface information is also advantageous when investigating the appearance and properties of technical surfaces for process and production control.
The example of dental implants shows that there are applications in which an areal analysis is required to obtain a qualified statement. But even if not absolutely necessary, optical 3D measurement technology is a good alternative to tactile methods in many cases. It offers quality inspectors and process developers a higher level of information and thus more reliability.


